

Freshwater is not limited to what appears on the surface in rivers or lakes. Hidden beneath the ground lies a vast and often overlooked reservoir—a resource that, until recently, proved challenging to measure with accuracy.
Thanks to significant advances involving artificial intelligence (AI), researchers are now producing clearer images of these concealed water supplies, revealing details that could influence agricultural strategies, policy choices, and environmental stewardship across the country.
By utilizing extensive datasets and sophisticated machine learning algorithms, scientists have begun to redefine how groundwater in the United States is assessed, managed, and understood. With the advent of a new high-resolution map, both local and national stakeholders now have access to unprecedented insight regarding the location—and depth—of this crucial water source beneath American soil.
Unveiling underground reserves with greater clarity
The majority of the nation’s freshwater actually resides below the surface at varying depths. For decades, estimating its true scale remained difficult due to fragmented data and outdated, broad-scale models that frequently missed local nuances.
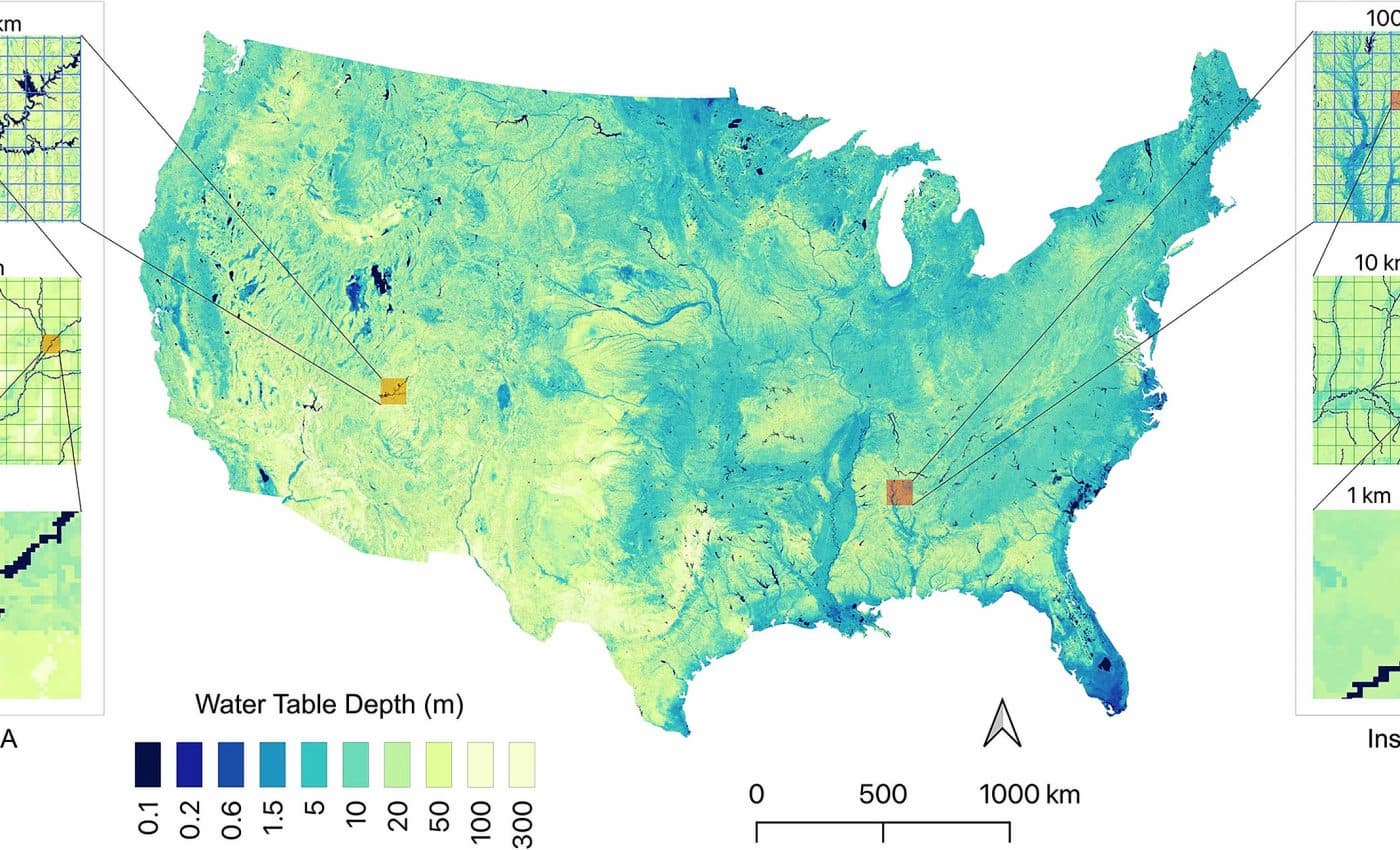
Recent initiatives have integrated over a million direct measurements collected across many years, shifting from a generalized county-level overview to an intricate mosaic that reflects conditions at much smaller scales.
This detailed approach exposes not only regions abundant in shallow groundwater but also those where reserves are less accessible and more vulnerable. In fact, findings indicate that total groundwater volume in the continental United States far exceeds visible quantities held in bodies like the Great Lakes—potentially containing thirteen times their combined capacity.
From coarse approximations to detailed grids
Traditional groundwater maps often aggregated information, providing just one estimate for each large district or watershed. The AI-driven method, however, divides the landscape into small grid cells—sometimes as compact as one kilometer across. By analyzing such fine points, subtle patterns emerge, including pockets of readily available water that larger-scale maps might overlook.
Agricultural planners, engineers, and conservationists all benefit from this improved perspective. Where previous models may have missed shallower reserves essential for sustaining crops during critical periods, these precise insights could prove decisive for future planning.
Assessing uncertainty and reliability across regions
Not every region offers the same level of scientific certainty. The process incorporates a measure of uncertainty for each location, indicating where predictions are most reliable and where caution remains necessary. In practice, uncertainty tends to be higher in arid western states, largely because fewer direct measurements exist there compared to the eastern regions.
The model employs machine-learning techniques known as random forests. By comparing slightly different results produced by numerous decision trees within the forest, researchers can quantify the relative confidence of each prediction. Areas backed by robust data inspire greater trust in local water-management decisions, while highlighted “red zones” on the map encourage further investigation before major infrastructure projects move forward.
The role of big data and machine learning in water science
What distinguishes this breakthrough is not merely the massive amount of information involved, but the integration of diverse sources. Climate records, geological surveys, and historical well readings spanning more than a century feed into advanced algorithms capable of detecting trends invisible to manual analysis.
The team behind the project compiled observations dating back to 1895, effectively creating a time-lapse view of subsurface water changes nationwide. Even though many locations provided only a single measurement throughout their history, innovative statistical methods enabled gaps to be filled and credible predictions made between points.
- Over a million direct depth samples included in the training dataset
- A wide range of climatic and soil attributes analyzed alongside physical measurements
- The model encompasses more than a hundred years of observation
- Designed for continual updates as new data becomes available
Each decision tree in the random forest independently estimates a site’s groundwater level. Comparing their outputs demonstrates how consistently the data point toward a particular answer or diverge, clarifying when extra scrutiny is warranted.
Researchers anticipate that as additional data flows in from remote sensors, drones, and citizen science, upcoming versions of the map will become even more accurate.
Applications and impact beyond research circles
Precision holds particular significance for countless daily decisions concerning water use. Farmers determining irrigation schedules, city planners evaluating housing developments, and industries seeking sustainable extraction all depend on up-to-date groundwater knowledge.
In areas where agriculture relies heavily on shallow groundwater, missing or outdated data can jeopardize yield forecasts and food security plans. The AI-based system aids stakeholders in allocating resources efficiently, avoiding missteps, and fostering long-term resilience against drought or excessive consumption.
Transparency stands out as another key feature—the resulting groundwater dataset has been publicly released, making it accessible to academic researchers and practitioners alike. This collaborative spirit encourages ongoing refinement, peer review, and creative adaptation, both for American needs and international applications.
Initial global pilots already suggest opportunities for adaptation in Europe, Australia, and Brazil, signaling a future where worldwide cooperation on groundwater science delivers broader benefits.